Each of these went from an idea to something you can open and use. Where a project is live, the link goes straight to the running build; where it is a pipeline or an engine project, the link goes to the source.
An Icy Tower-style canvas platformer you can play with your hands, via webcam tracking.
JavaScript
Canvas 2D
MediaPipe
WebAssembly
Web Audio API
+1
Live · Read the case study ›
Open repositories
The 5 projects whose source is public, read live from the GitHub API. The remaining one is in a private repository, so it is represented here by its running build instead of by a link that would 404.
Public repositories behind the projects on this site, with their primary language, repository size and most recent push.
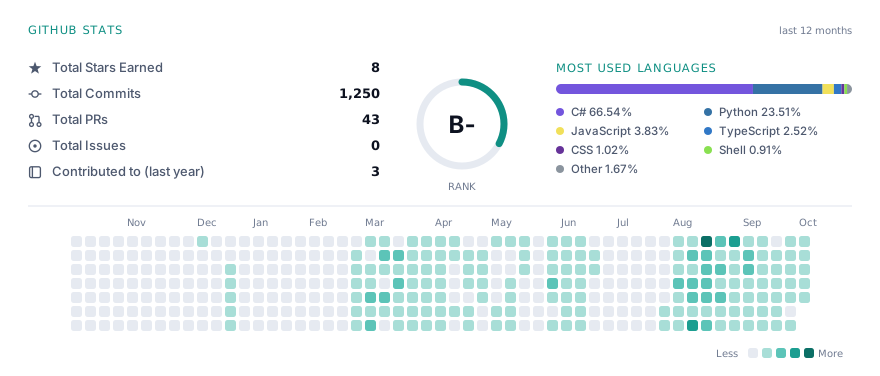
Read live from the GitHub GraphQL API, so it cannot drift away from the profile itself. Over the last twelve months: 1,367 contributions across 168 active days, 1,279 of them commits, with a longest unbroken run of 51 days.
Contributions
1,367
Commits
1,279
Pull requests
62
Public repositories
14
Active days
168
Longest streak
51 days
Most used languages
Share of code by bytes, counted the way GitHub’s linguist counts it, across my public repositories. C# leads because one of them is a Unity project, which is a great deal of code for one game; the private repositories, where most of the TypeScript lives, are not counted.
C#66.5%
Python23.6%
JavaScript3.8%
TypeScript2.5%
CSS1.0%
Shell0.9%
Other1.7%
Contribution graph
Every day of the last year, one square each, darkest on the busiest day (60 contributions). The same graph is served as an image at /github-stats.svg, which is what my GitHub profile README embeds.